
Dive Deep with Captain’s Stock Profiles
Every stock has a story to tell. Captain’s stock profiles tell all of these stories in one convenient place so that you can dive into everything from technical indicators to insider trades and everything in between and feel confident in your research. Captain tracks over 65,000 stocks from across all of the major US exchanges like NYSE, NASDAQ, NYSE ARCA and American and OTC markets.

You can access a stock’s profile page by typing in the ticker in the search bar on top of every page of the site.

The top section of the page from left to right includes a description of the company and what it does, a chart of conversation volume over the last 60 days and which analysts talk about this stock the most. One way to build up an analyst watchlist is to look up stocks you like and take a look at these key opinion leaders - you might find some of the same names again and again and choose to add them to your watchlist.

The commentary chart graphs price with conversation volume over time. Earnings dates are called out on the chart as well. You can hover over any analyst profile picture to view the text of their post at that time. This is great for seeing who might have been early (or late) in calling out a big move or who was right on (or wrong) about other significant events.
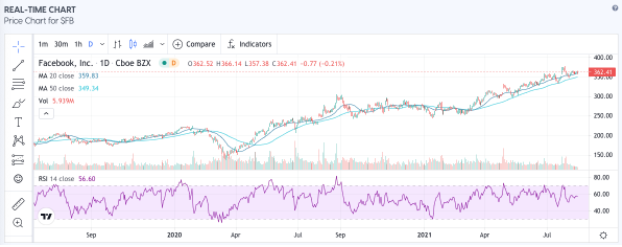
The real-time price chart lets you not only see the price history at a glance but add any technical indicators you want, draw trendlines and even compare other stocks all in one place. This is great for giving you some big picture context on what has been going on with the stock.

The insider trades chart displays insider trades over time as well as how much was bought or sold. The table below it has all the details for you to dig into. This data is updated multiple times per day direct from the required SEC documents. $FB is one of our favorite examples since Mark Zuckerberg has been consistently selling shares daily since the 2020 US election, perhaps indicating his fears of increased regulation in the new administration.

Next we have congressional trades which show which members of congress have been trading the stock. A similar breakdown of buys / sells is shown although the reported data is less precise and often reported many days or months after the trades took place. If that sounds fishy to you, you’re not alone and the only hope is to write your reps and get them to police themselves more effectively or perhaps impose any penalties at all on themselves when they do break their own rules.

The recent alerts table shows the last five alerts we’ve sent for that stock and links to the alert details.

Fundamentals show key fundamental metrics for the stock.

Conviction History is a heatmap of sentiment over time broken down hour by hour. Popular stocks show similar stocks that are popular. Thread Explorer shows popular threads mentioning the stock and Chart Explorer shows recent posts with charts in them.

Finally, Latest News shows the most recent news articles about the stock and Google Trends shows the history of searches done for the company’s name and stock ticker. Google Trends is great for helping to figure out if the general public is also talking about the company / stock or if it’s just a finance echo chamber.
Put it all together it’s easy to see why so many people have made Captain’s stock profiles an essential part of their due diligence and research process.